
Building an easy-to-update financial presentation
Below, tips & tricks on creating a foundational financial presentation that will make your life easier.
Here at SlideRabbit, we help streamline quarterly- and monthly-reporting for many clients. Whether reporting to leadership or customers, creating a deck that is both clear & effective and easy to frequently update can be a challenge.
Creating a better financial presentation
Synthesizing your data
Your first step to creating an effective financial presentation is identifying the information you’d like your audience to walk away with, and then simplifying your data to provide them with intuitive conclusions.
For instance, if you are working with granular data, you’ll need to analyze it in order to find a simple graph expression that makes the takeaways clear.
Creating templatized slides
Once you have your approach settled, create foundational slides that can be easily updated. To make your life as easy as possible:
- Build your graphs in PPT
Building in PPT ensures that your data will remain appropriately linked and travel with the file so you can always update your graphs without having to rebuild or wrestle with formatting. - Mark your updatable fields
Create a visual cue to yourself for the areas that must be updated each time. Whether it’s dates, data, or takeaways, mark these areas or leave notes so that you don’t have to go hunting every time. - Invest in a clean up
Once you have your main deck set and ready, it may be a good idea to invest in the look of that foundational financial presentation. Whether it’s an internal resource, or an external service, creating a clean designed look makes even more sense for presentations that will be used regularly.
The ins and outs of linking data
You may be asking – updating graphs each month?? Can’t I just link an Excel file?
Yes, you can. But there are many pitfalls to be aware of when going this route.
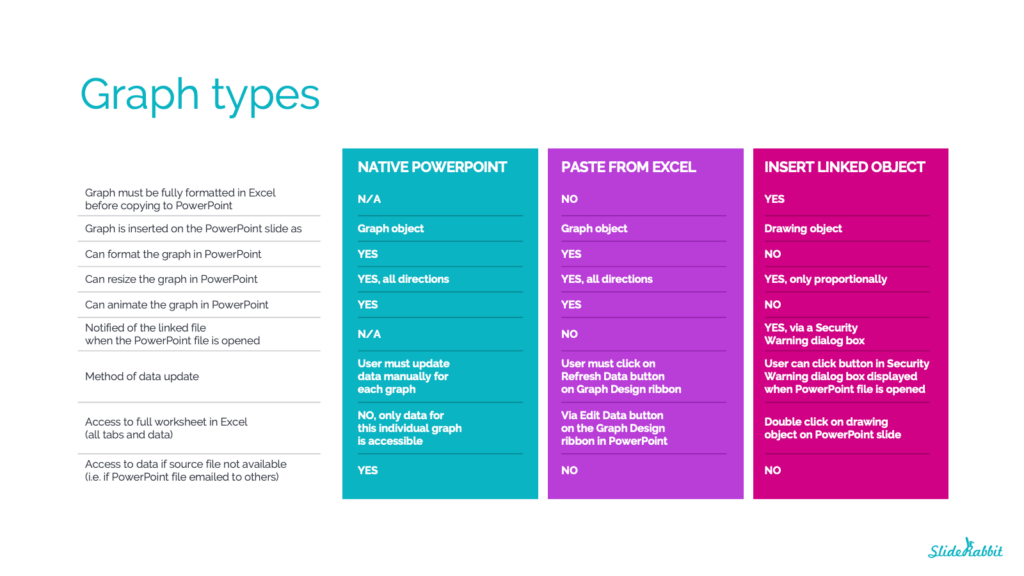
When inserting your graph from Excel, use a basic paste to insert a live graph that can be formatted and animated in PowerPoint. You can use the “Refresh Data” button in the Chart Design ribbon, but be aware that moving or renaming either the PPT or the Excel will break the link. To send these files around to be worked on by others, zip them together.
Avoid using Paste Special > Insert Linked Object, which will embed your entire Excel workbook. That is dangerous because this embedded file will travel with the file and could turn into a data security issue. Linked Objects also cannot be formatted or adjusted in PowerPoint.
Here’s a quick reference on how various chart creation methods work in PowerPoint.
Want to see some samples? Check out our portfolio and then get in touch!


Leave A Comment
You must be logged in to post a comment.