Building An Interactive Infographic in PowerPoint
Lately we’ve been thinking a lot about pushing presentation software past simple slides. Keeping with the theme, we recently received an interesting challenge from one of our clients: an interactive infographic produced and executed in PowerPoint.
Why PowerPoint you might ask? Why not Prezi or Flash? For clients with a large sales team, introducing a new software across the board can be cost prohibitive. We needed a platform that the sales team was already comfortable with and which would allow the team to update numbers and figures on the fly. PowerPoint was the clear answer, but since PowerPoint takes a lot of flack for its linear format, how could we make a truly interactive infographic?
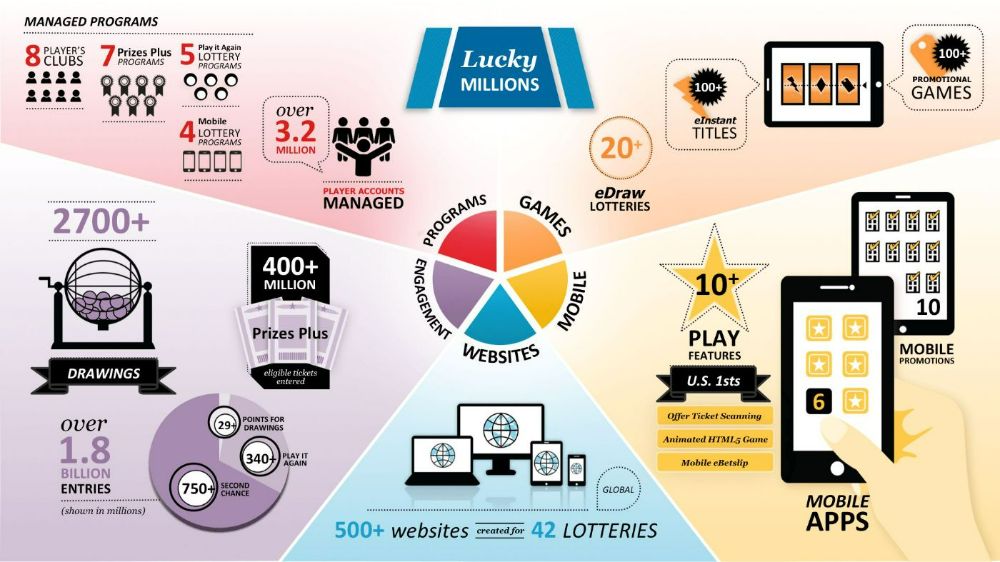
We were up for the challenge. Here’s a sample of the finished product.
(Workproduct has been edited to remove identifying company information.)
Here’s How We Did It
…and a few of the challenges we ran into along the way.
Click to view larger
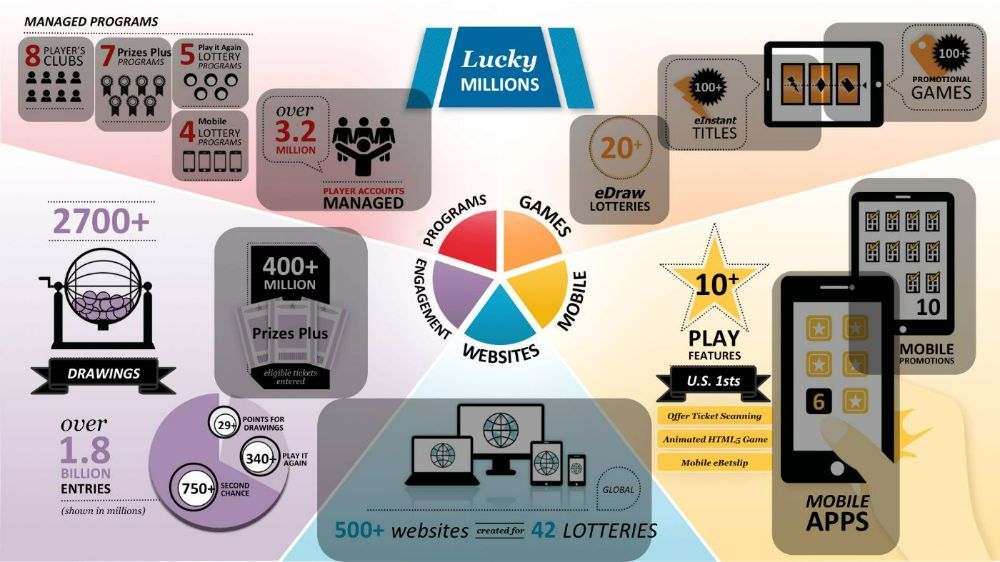
The first step was building the base infographic. The client needed to be able to edit text on the fly, so we pulled in our icons from Illustrator and built everything else natively in PowerPoint.
To keep things easy to edit, we put the base infographic into a master slide – this way any edit to the infographic would immediately populate through the file, eliminating the need to edit the base image on every slide.

Click to view larger
Next we designed data detail overlays for the expanded information set to pop out from various data points. We gave the expanded information slides their own master style which included a fade effect. We designed the popouts and data visualization in the main slide editor – one slide per pop out.
Once we had all our info built out, it was time to build in some “interactivity.”
Truly, PowerPoint is built to be a linear presentation tool. The intent is that the speaker will advance one slide to the next without deviating from the plan.
There is one tool in PowerPoint that allows for some non-linear jumping: Hyperlinks (Insert > Hyperlink). The hyperlinking tool can be used to make richer and more informative presentations by linking slide elements to web pages, associated documents or slides within the presentation.
Our plan was to use inter-slide linking to create an interactive infographic piece. We wanted to link various data points to detail pop out slides so that the presenter could interact with his audience and pull up additional information. Here we ran into our first obstacle:
Obstacle #1: Hyperlinks Cannot be Applied to Groups
Click to view larger
Our data points were all made up of a mix of design elements: icons, text boxes, lines, etc. Without group linking, we’d have had to link each element, leaving un-linked space between elements and bogging down our file. Instead, we needed a clean link that would allow the user to click anywhere over the group of elements and bring up the expanded data.
To get around the issue, we created a series of invisible boxes to overlay our data facts. Before we eliminated their fill, they looked like this. We then linked these boxes to the appropriate slides and made them invisible. Now clicking over any grouping hit these invisible link boxes, which brought up additional information, creating an interactive infographic.
Obstacle #2: Slide Transition Lag
Now our file is functional, but we were experiencing a lag between clicking a data point and the new slide coming up of several seconds. A lag this severe could potentially cause the user to panic during a presentation, clicking twice and confusing the file. Even more importantly, it indicates that PowerPoint it working too hard and could quit unexpectedly.

Click to view larger
The problem was the sheer number of design elements on each slide. The base infographic contained so many shapes and images that PPT had to redraw for each slide.
Since the client wanted edibility, we couldn’t use a static image, so we met half way. We pulled all the text off the slide and saved out the resulting image as a hi res .png file. We than imported that to a master slide and layered all the text over the image. To keep editing easy, all the text is in one group, so it can be easily brought to the front of all the clear link box layers and edited there.
Obstacle #3: Misclicks End the File
To move from each detail slide back to the main interactive infographic, we included a “close” button on each detail pop out that linked to a slide containing the main infographic. The user could then click on another data point to bring up a new detail slide. A little playing revealed that any misclick, whether it be missing the “close” button or clicking a spot on the main infographic that was not covered by a link box, would end the file. PowerPoint was reading that misclick as a slide advance and, because we were on the last slide, it thought the presentation had concluded.

Click to view larger
To resolve the issue, we added another clear link box. This one was the size and shape of the entire slide and linked right back to the main interactive infographic. A misclick now hit this link box, bringing up the same slide again and giving the user another chance to correctly hit his target. In order to keep the other links clickable, the large link layer needed to be behind any other active links and in front of any text or images. Here’s what the full slide link box looked like on the detail slides before we removed the fill. It sits behind the “close” link and in front of any other elements.
PowerPoint is often dismissed as a necessary office evil incapable of producing attractive and unique presentations, but with a little creativity and know-how, PowerPoint can be an accessible and powerful platform to create engaging and advanced marketing pieces, including interactive infographics.
Have you subscribed to our newsletter, In the Hopper, yet?


Leave A Comment Cancel reply
You must be logged in to post a comment.